Metrics
OneTable can emit detailed custom metrics to track DynamoDB performance and usage on a per app/function, index, entity model and operation basis.
These metrics can be emitted using Cloud Watch metrics or CustomMetrics
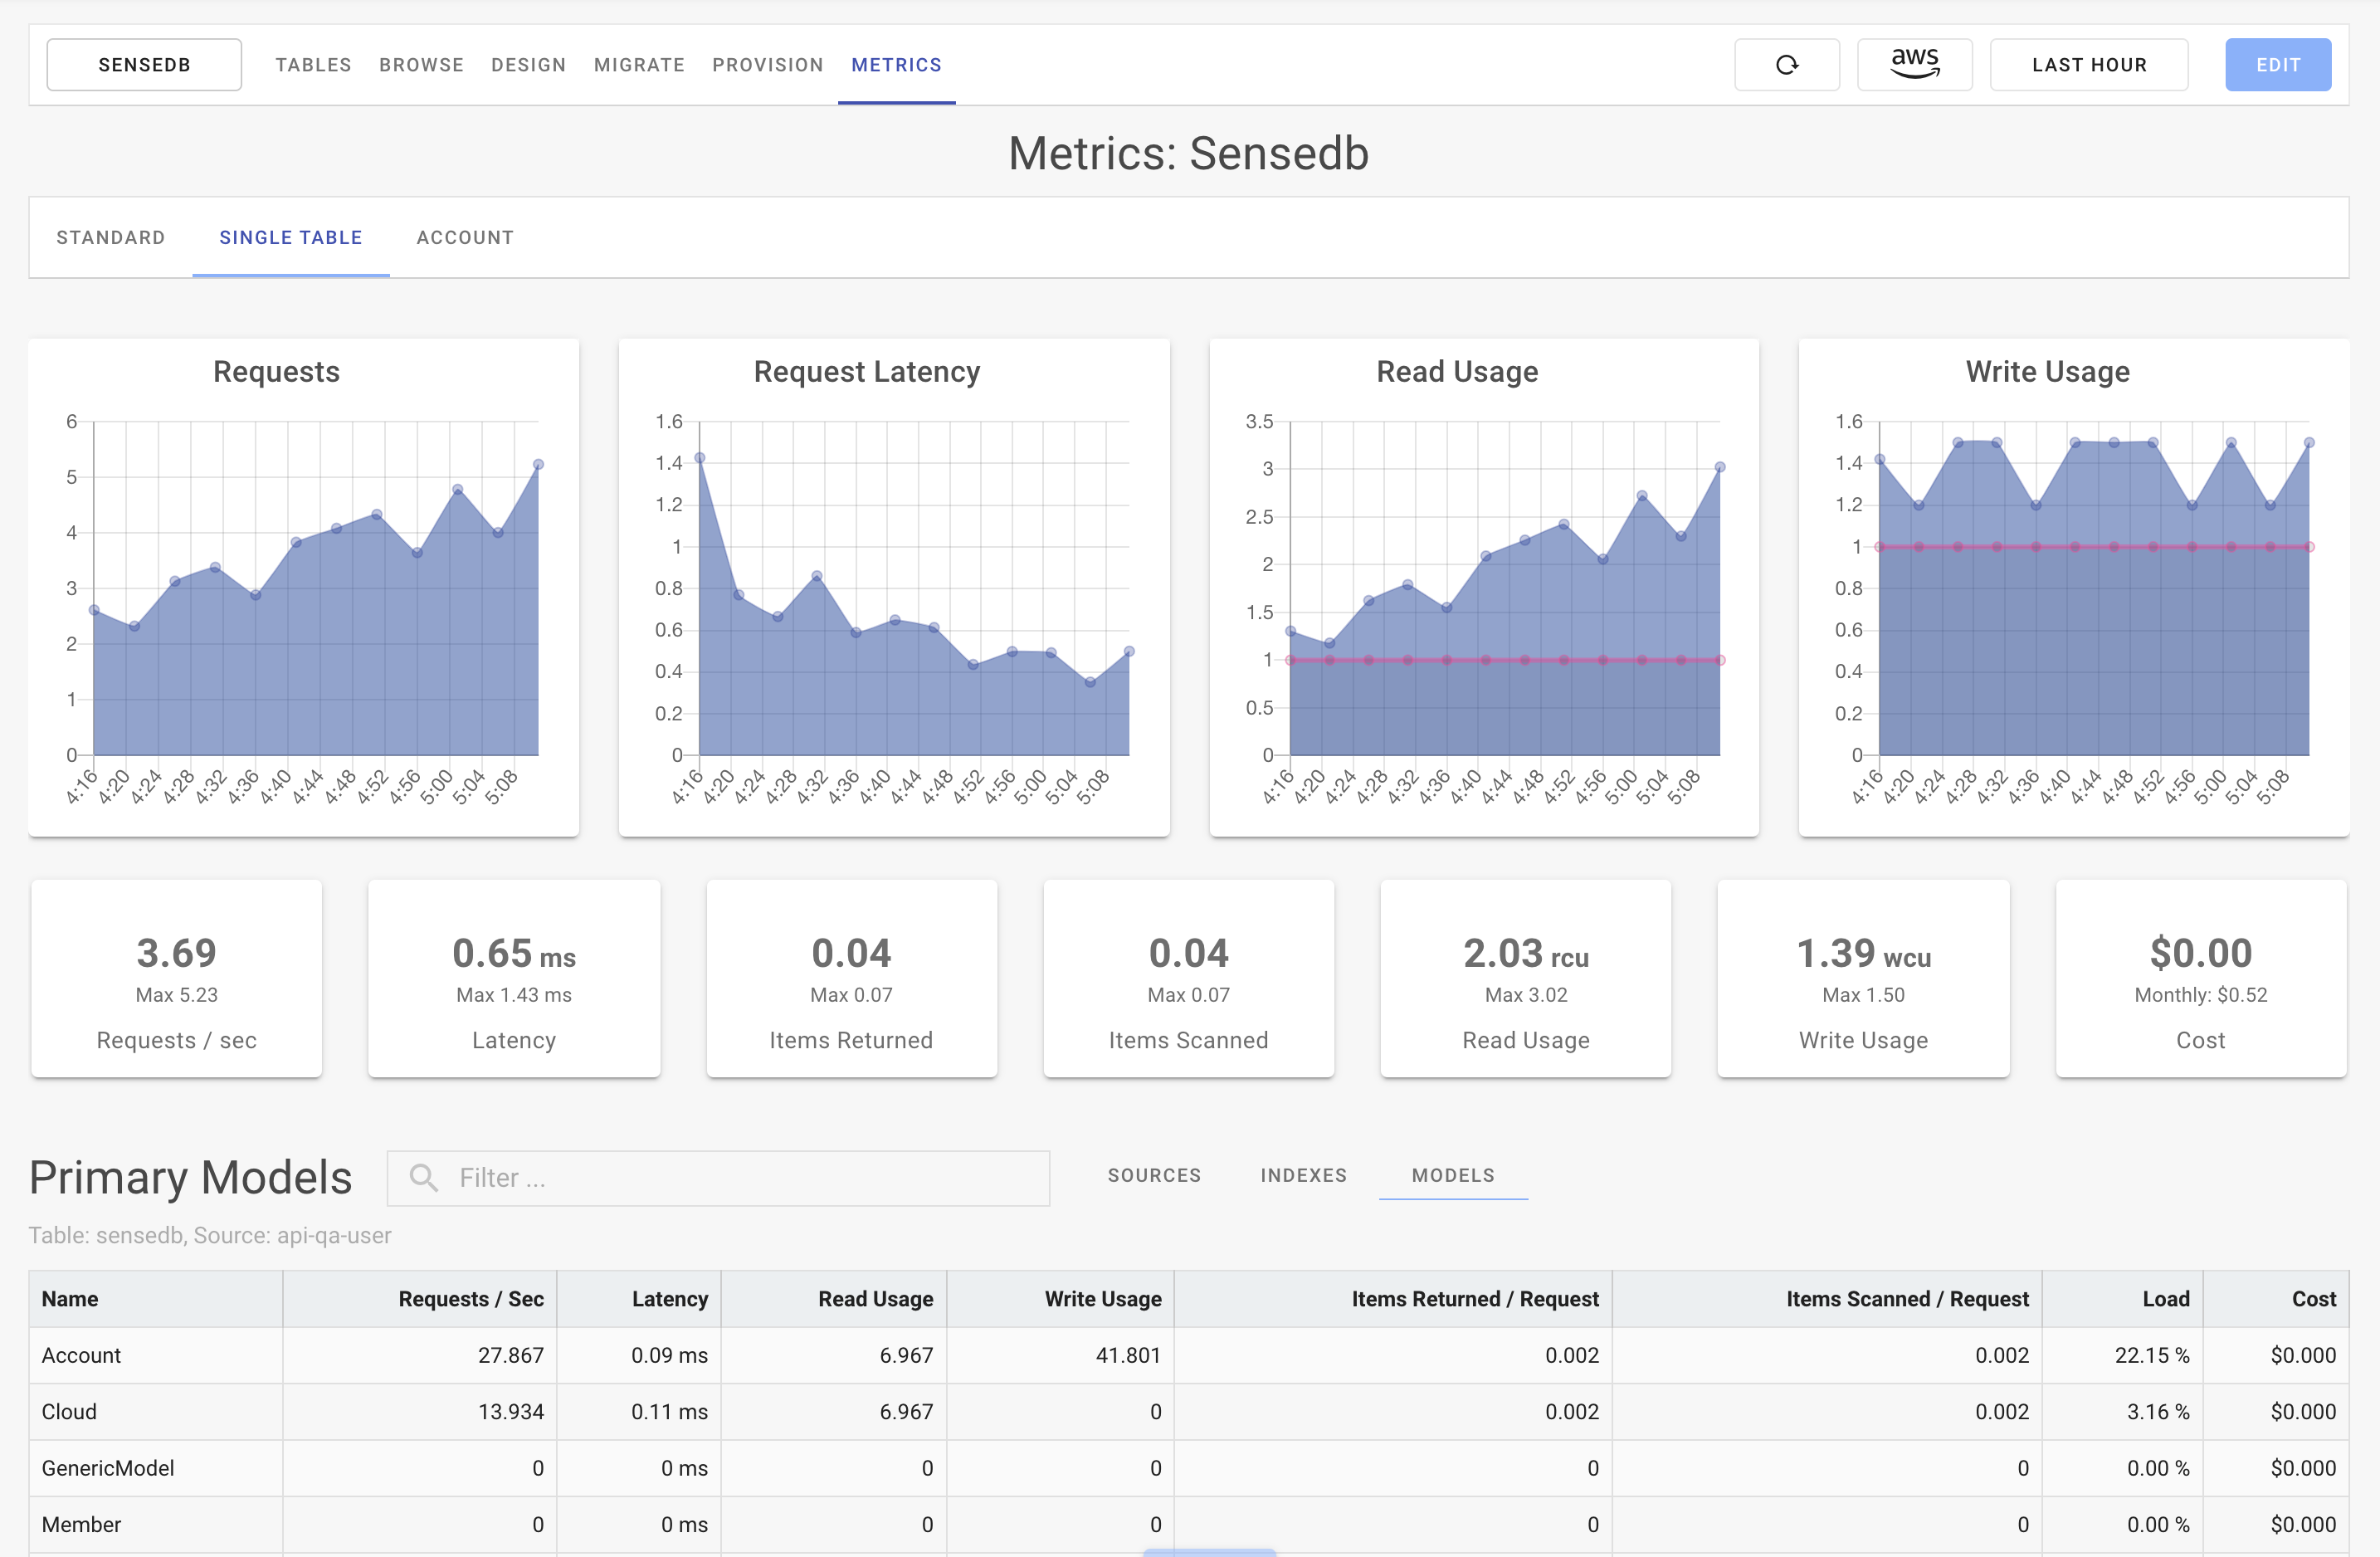
SenseDeep can present and analyze these metrics to gain insights and visualizations into how your single-table designs are performing.
Metric Details
The following metrics are emitted:
| Metric | Description |
|---|---|
| read | Read capacity units consumed |
| write | Write capacity units consumed |
| latency | Aggregated request latency in milliseconds |
| count | Count of items returned |
| scanned | Number of items scanned |
| requests | Number of API requests issued |
Each of these metric can be emitted for the following dimensions:
| Dimension | Description |
|---|---|
| Table | |
| Tentant | Customer or user responsible for the database access |
| Index | Primary or secondary index |
| Source | Application, service or function responsible for the access |
| Model | Single table model |
| Operation | DynamoDB operation |
The default dimension are Table, Index, Source and Model.
The dimensions are emitted for progressive combinations. i.e. Table, Table+Tenant, Table+Tenant+Index, etc. This means you can see detailed metrics at multiple levels. You can see overall metrics for the table, or a table and index, or for the table, index and application.
Metrics Params
The properties of Table constructor params.metrics property are:
| Property | Type | Description |
|---|---|---|
| chan | string |
Log channel to use to emit metrics if using SenseLogs. Defaults to 'dbmetrics'. |
| dimensions | array |
Ordered array of dimensions to emit. Defaults to [Table, Index, Source] and includes Tenant if the tenant property is set to true. This can be modified at runtime via the LOG_ONETABLE_DIMENSIONS Lambda environment variable. |
| enable | boolean |
Set to true to enable metrics. Defaults to true. |
| env | boolean |
Set to true to enable dynamic control via the LOG_FILTER environment variable. Defaults to true. |
| max | number |
Number of DynamoDB API calls for which to buffer metrics before flushing. Defaults to 100. |
| namespace | string |
CloudWatch metrics namespace for the metrics. Defaults to SingleTable/metrics.1. |
| period | number |
Number of seconds to buffer metrics before flushing. Defaults to 30 seconds. |
| properties | map|function |
Set to a map of additional properties to be included in a CloudWatch EMF log record. These are not metrics. Set to a function that will be invoked as properties(operation, params, result) and should return a map of properties. Defaults to null. |
| source | string |
Name of application or function name that is calling DynamoDB. Default to the Lambda function name. |
| tenant | string |
Set to an identifying string for the customer or tenant. Defaults to null. |
Dynamic Control
Metrics can be dynamically controlled by the LOG_FILTER environment variable. If this environment variable contains the string dbmetrics and the env params is set to true, then Metrics will be enabled. If the env parameter is unset, LOG_FILTER will be ignored.
You can also use the LOG_OVERRIDE environment variable. This operates like LOG_FILTER but for a specified duration of time. The format of LOG_OVERRIDE is:
1 | |
Where expire is a Unix time in msec since Jan 1, 1970 (Date.now()) and filter is a LOG_FILTER string containing dbmetrics.
The metric dimensions can be controlled by the LOG_ONETABLE_DIMENSIONS environment variable. Set to an ordered, comma separated list of dimensions. The dimensions will be progressively combined. i.e. A dimensions list of [Table, Index, Source] will result in the dimensions [{Table}, {Table+Index}, {Table+Index+Source}].
Profiled Queries
You can also generate metrics for specially profiled queries and scans via the params.profile tag. The profile param takes a unique string tag and metrics will be created for the dimension {Profile: profile-tag-name}. These metrics exist outside the standard dimensions specified via the Metrics dimensions parameter.
Performance and Cost
Single table metrics are very granular and the combination of metric dimensions can get large. This can impose a significant load on your applications and database (if using CustomMetrics) or CloudWatch Metrics if using EMF.
To minimize the cost, only use the metric dimensions you really require. Also, use the dynamic log control environment variables LOG_FILTER and LOG_ONETABLE_DIMENSIONS to enable and disable OneTable metrics for short durations. SenseDeep makes this easy, by supporting override log environment variables that automatically
The other way to minimize the performance impact is to use a larger period and max property in your Table params.metrics constructor property.
Background
OneTable Metrics are emitted using either CloudWatch EMF or CustomMetrics.
AWS CloudWatch offers metrics to monitor specific aspects of your apps that are not covered by the default AWS infrastructure metrics.
Unfortunately, the AWS "custom" metrics can be very expensive. If updated or queried regularly. Each each custom metric will cost up to $5 per metric per year with additional costs for querying. If you have many metrics or high dimensionality on your metrics, this can lead to a very large CloudWatch Metrics bill.
Custom Metrics
CustomMetrics provides cost effective metrics that are up to 1000 times cheaper and 10 times faster than standard CloudWatch metrics.
CustomMetrics achieves these savings by supporting only "latest" period metrics. i.e. last day, last month, last hour etc. This enables each metric to be saved, stored and queried with minimal cost.
CustomMetrics stores metric data in your DynamoDB database table using a unique key so that it can co-exist with your application data. Metric data is buffered and aggregated so the impact on your DynamoDB utilization should be minimal.
CustomMetrics are emitted using a primary key of metric#1#owner. MOB -- config option
CloudWatch EMF
Metric emitted using CloudWatch EMF permit zero-latency creation of metrics without impacting the performance of your Lambdas.
If your CloudWatch costs are too high, you can minimize your charges by reducing the number of dimensions via the dimensions property. You could consider disabling the source or operation dimensions. Alternatively, you should consider SenseLogs which integrates with OneTable and can dynamically control your metrics to enable and disable metrics dynamically.
DynamoDB Metrics are buffered and aggregated to minimize the load on your system. If a Lambda function is reclaimed by AWS Lambda, there may be a few metric requests that are not emitted before the function is reclaimed. This should be a very small percentage and should not significantly impact the quality of the metrics. You can control this buffering via the max and period parameters.
Read More
Read more about how to use and configure metrics at Understanding Your DynamoDB Performance.
The metrics can be viewed in CloudWatch or best via SenseDeep which has detailed graphs for your single-table monitoring for DynamoDB.
 .
.